
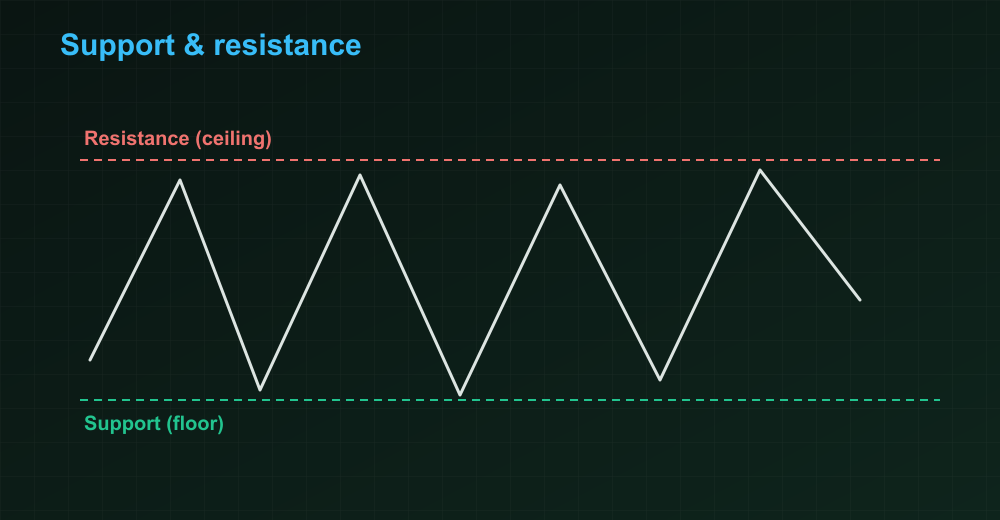
Support is a price floor where buyers step in. Resistance is a ceiling where sellers appear. Together they map where a chart is most likely to react.
Why do these levels form?
Markets have memory. If a stock keeps bouncing near Rs.400, buyers defend it and it becomes support; if it stalls near Rs.500, that becomes resistance.
Key idea: Support and resistance are zones of probability, not exact walls. Think in ranges, not to-the-rupee precision.
How to find them
- Prices where the chart reversed multiple times.
- Obvious swing highs and lows.
- Round numbers act as psychological levels.
Two ways to trade them
- The bounce: buy near support with a stop just below it, targeting resistance.
- The breakout: when price closes firmly through a level on strong volume, old resistance often becomes new support.
Key takeaways
- Support = floor of buyers; resistance = ceiling of sellers.
- Levels strengthen the more they are tested.
- Trade bounces off levels or breakouts through them.
- Broken resistance often becomes new support.
Practise this on ShareRocketPro
Sign up with your name, phone number and a password, get Rs. 10,000 in practice money and trade every NEPSE scrip in our 24/7 practice market — virtual money with no cash value, so zero real-money risk.